
What Extrafemi’s Hormuz Tracker Does Better
Extrafemi’s Hormuz Crisis Tracker was built to answer a different one: “What is this doing to the global system?”
By Extrafemi · Substack Edition
In the weeks since the Strait of Hormuz closed, a small ecosystem of dashboards has emerged to help people make sense of the crisis. Some focus on AIS ship positions. Others focus on spot prices, pipelines, or carrier status. All are useful. But they mostly answer one kind of question: “What is happening in and around the strait right now?” Extrafemi’s Hormuz Crisis Tracker was built to answer a different one: “What is this doing to the global system?”
That difference shapes everything about how the tracker is designed.
From chokepoint to system map
Most dashboards treat Hormuz as a maritime or energy problem. Our starting assumption is that it is a systems problem. When 20% of global oil, 20–25% of LNG, 30–50% of seaborne fertiliser, and a large share of sulphur and helium all run through the same chokepoint, closing it does not just nudge a curve on an oil chart. It rewires how food, energy, and industry move through the world.
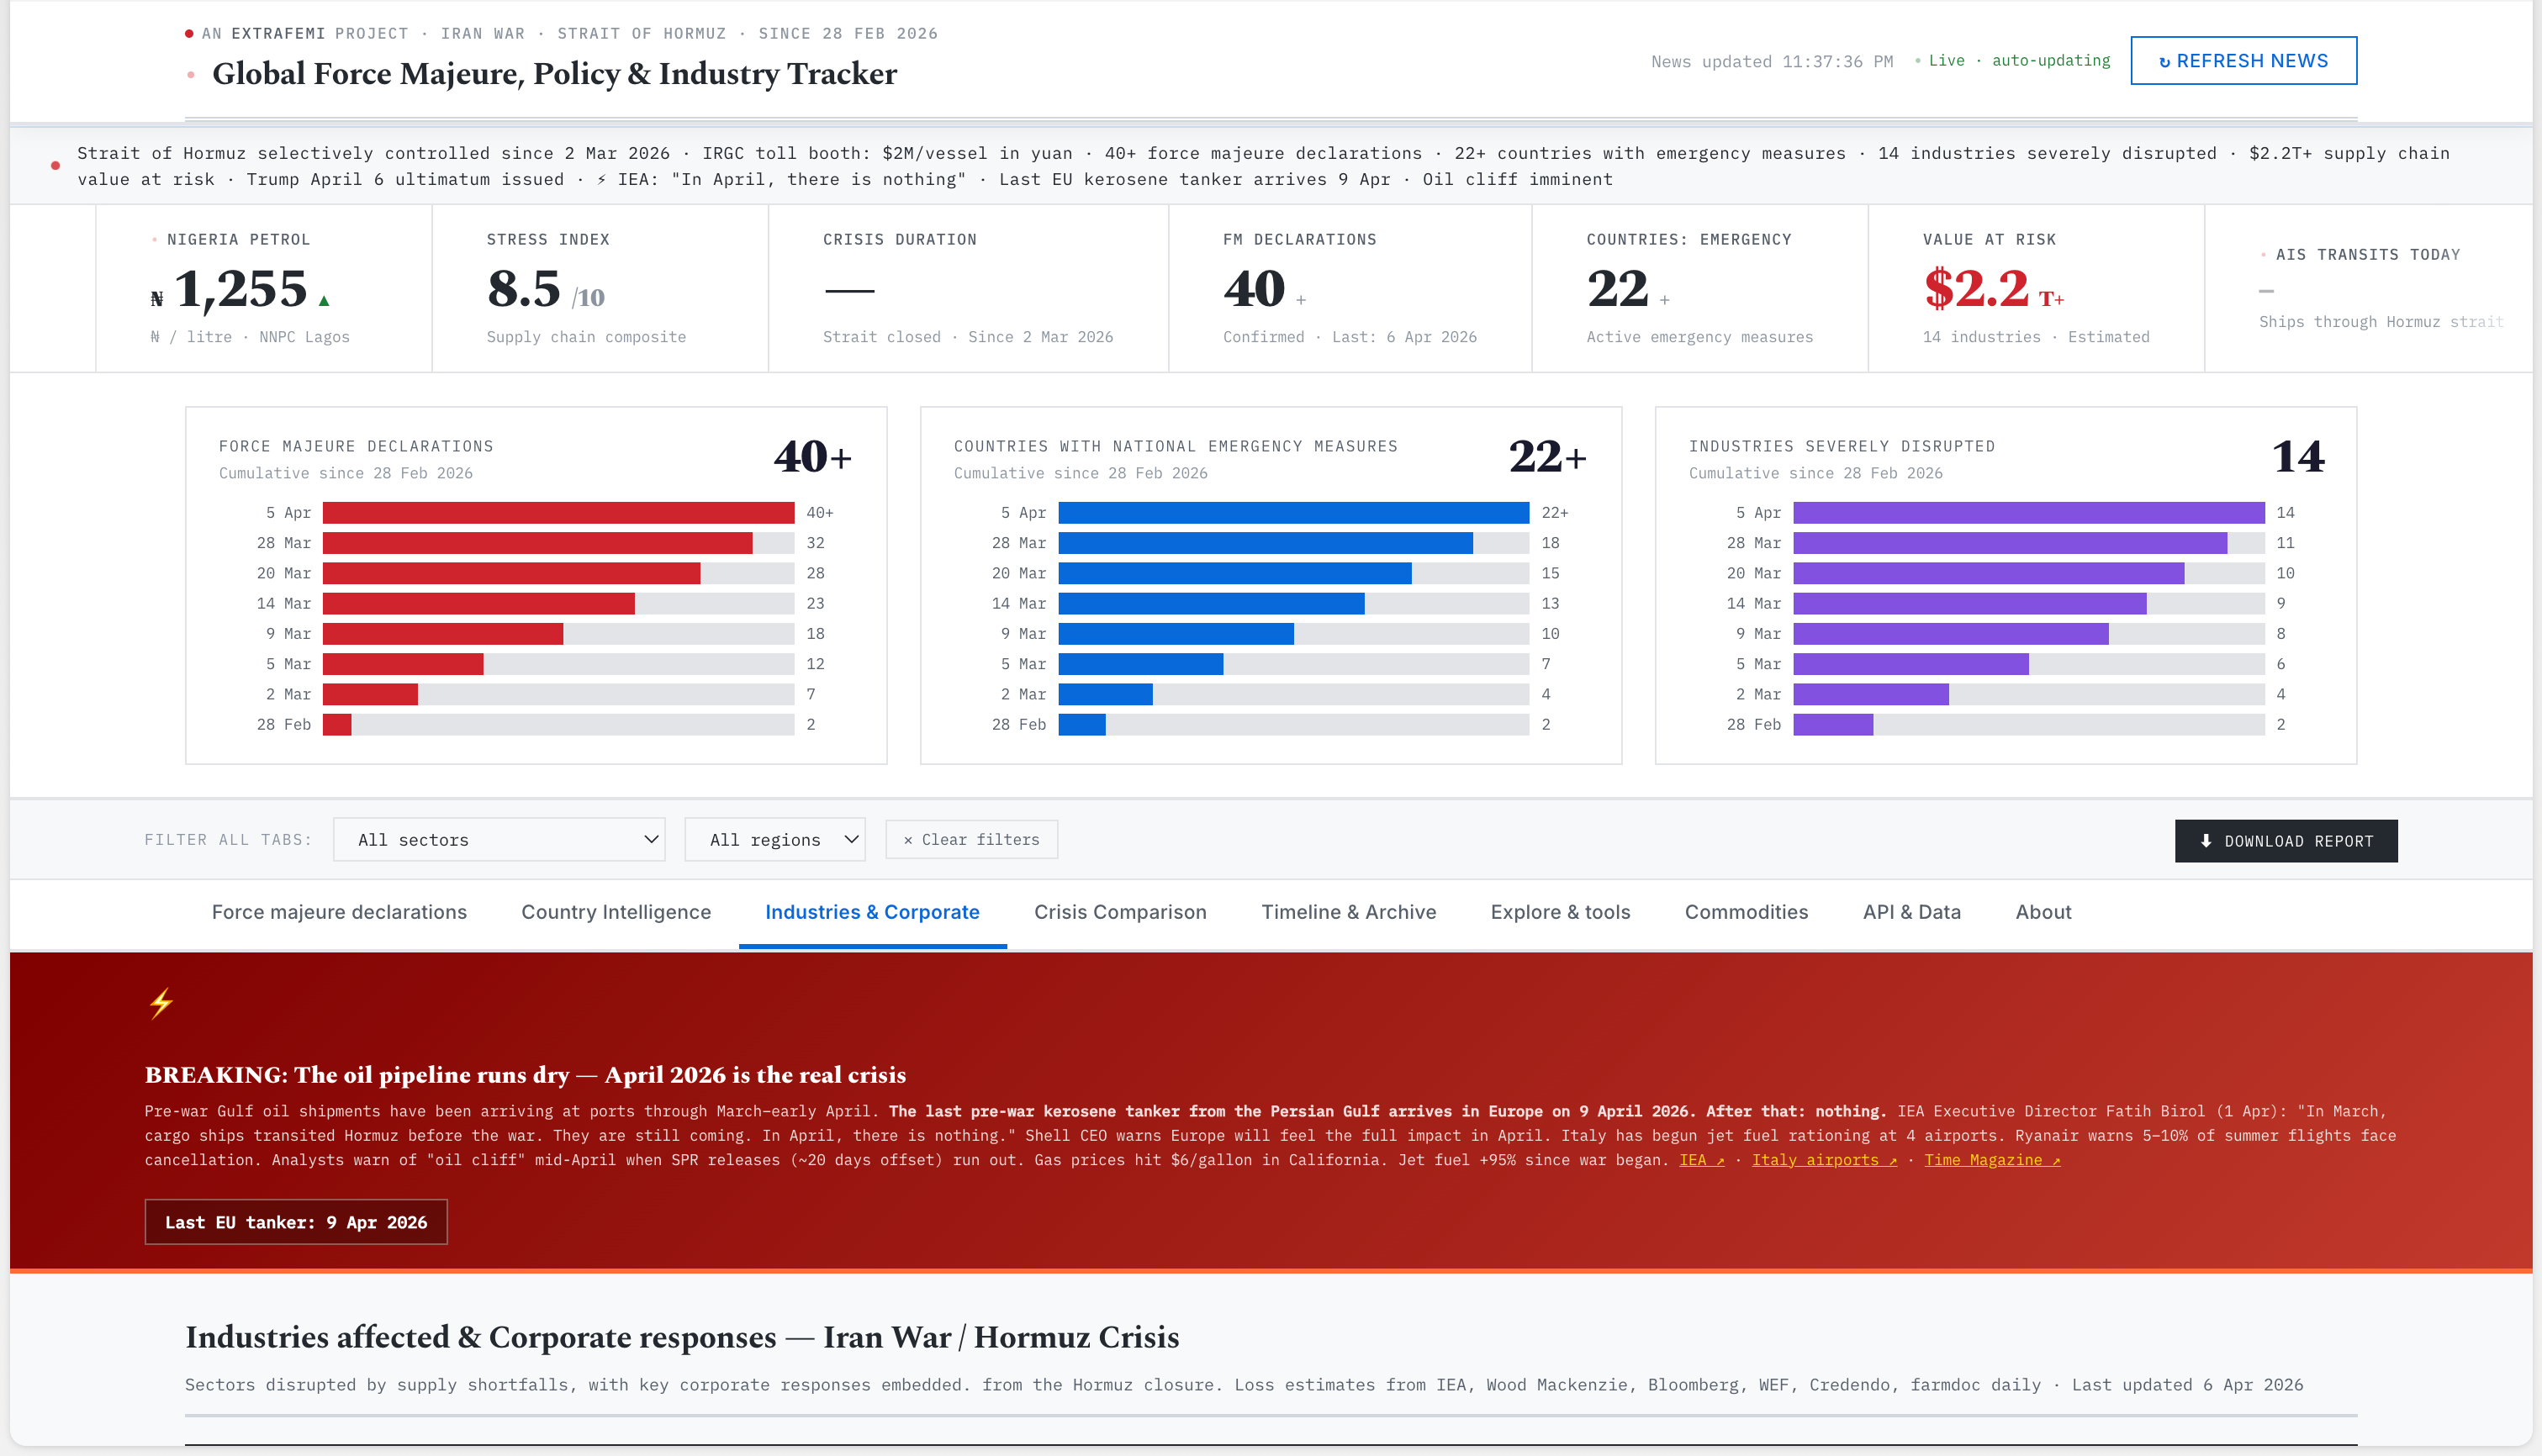
That is why the tracker is structured around three intertwined layers:
Force majeure declarations: who is declaring, in which sectors, with what first‑, second‑, and third‑order effects.
National policy responses: which governments are in emergency mode, what tools they are using, and how severe their exposure is.
Industry‑level disruption: from semiconductors and fertilisers to aluminium, aviation, pharmaceuticals, e‑commerce, and construction.
Instead of asking users to stitch those stories together from a dozen separate sources, the tracker puts them on a single canvas.
A lens from the Global South
Another deliberate choice is perspective. Many crisis dashboards are written from the vantage point of OECD energy importers or G7 markets. Extrafemi is based in Lagos, and the tracker is built to keep Global South exposure front and centre.
That is why there are dedicated sections on Gulf food and water security, Yemen’s deepening hunger crisis, South Asian energy‑food cascades, and an explicit “Nigeria lens” that pulls fuel, fertiliser, and e‑commerce exposure into one place. The aim is to make it impossible to talk about “the oil shock” without seeing the fertiliser shock, the food shock, and the household‑level reality that follows.
Structured data, not just a pretty chart
Visually, the tracker looks like a dashboard. Under the hood, it is closer to a research dataset with a UI wrapped around it.
Every force majeure event, policy measure, and industry impact is stored as structured data with a UUID, dates, sectors, and source links. That matters because this crisis is not just a news cycle; it is a live experiment in how the modern supply chain fails. Having a clean, documented schema for those failures is part of the long‑term value.
Timelines, not snapshots
Finally, the tracker is unapologetically historical. The “Timeline & Archive” section preserves snapshots at key dates: 28 February, 2 March, 5 March, 9 March, 14 March, 20 March, 3 April, 5 April, with counts of force majeure events, countries with emergencies, industries disrupted, and supply‑chain value at risk.
Many dashboards show you today’s numbers. Fewer make it easy to see how those numbers changed and what spilled into what. For anyone trying to understand causality, that matters more than an extra decimal place of real‑time precision.
Why this focus
Extrafemi’s Hormuz Crisis Tracker does not try to compete with specialised AIS maps or pure market data feeds. Instead, it stands on their shoulders and asks: If this is the largest coordinated supply shock in modern energy history, what does that actually mean for fertiliser in Kenya, garments in Bangladesh, aluminium in Detroit, or food prices in the Gulf?
“What it does better” is not that it is faster or flashier. It is that it treats Hormuz 2026 as what it is: a systemic rupture that connects oil, food, metals, debt, and human security and then gives you a structured way to follow that connection as it unfolds.
That is the lens we are publishing from, and the one this Substack exists to deepen.
Visit the Hormuz Crisis Tracker.